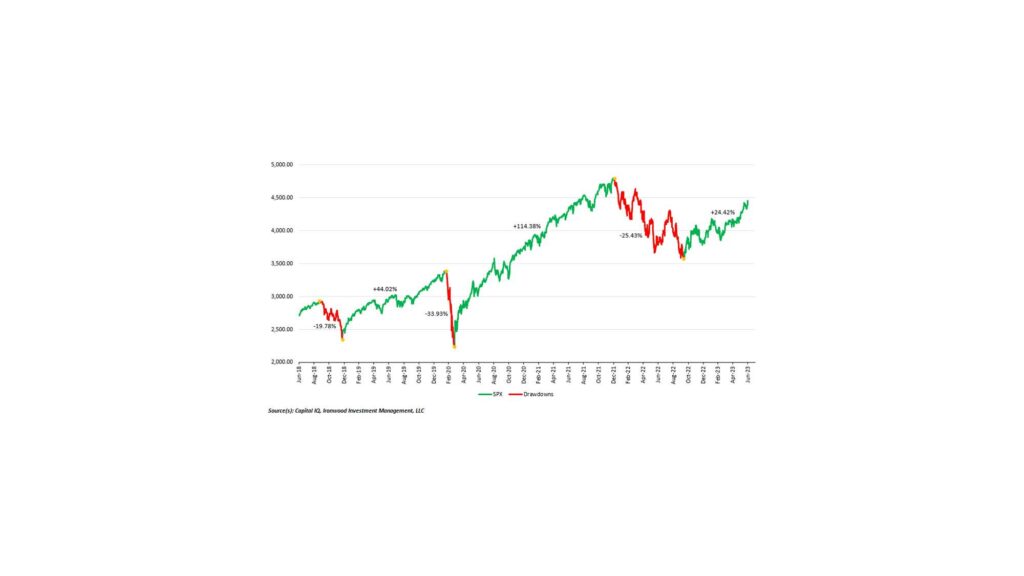
As the above chart of the S&P 500 demonstrates, the US equity markets have been exceptionally volatile in recent years. There have been three distinct periods of steady gains (highlighted in green): 12/14/18–2/19/20, 3/23/20–10/12/22, 10/12/22–6/30/23, when the index rallied 44.02%, 114.38%, and 27.41%, respectively. And there were three distinct periods when the index declined (highlighted in red): 9/20/18–12/14/18, 2/19/20–3/23/20, 1/3/22––10/12/22, with drops of 19.76%, 33.92%, and 25.42%, respectively.
The five-year period covered in the chart has been an especially eventful time. The financial markets have had to deal with a pandemic, a recession, the war in Ukraine, an inflationary spiral, and a rapid increase in short-term interest rates. Given the jarring economic impact of these events, it is no wonder that the financial markets have been volatile. But each time the markets have declined, they have rallied back.
So far, 2023 is keeping to this pattern. The markets sold off in 2022 on fears that the restrictive monetary policies adopted by the Federal Reserve (the Fed), principally rapid increases to short-term rates to combat inflation, would push the economy into a recession. Indeed, the Fed increased its target for the Fed Funds rate from near zero to a range of 5.0%–5.25%, the fastest increase on record and the highest level of short-term rates in 22 years. The growth rate of the US economy has slowed, but the economy has shown remarkable resiliency and has continued to grow. Gross National Product (GDP) expanded at a 2.0% rate in the first quarter of 2023 and accelerated to a 2.4% annualized rate in the second quarter. The consensus expectation for economic growth no longer calls for a recession in 2023, but for modest growth into 2024.
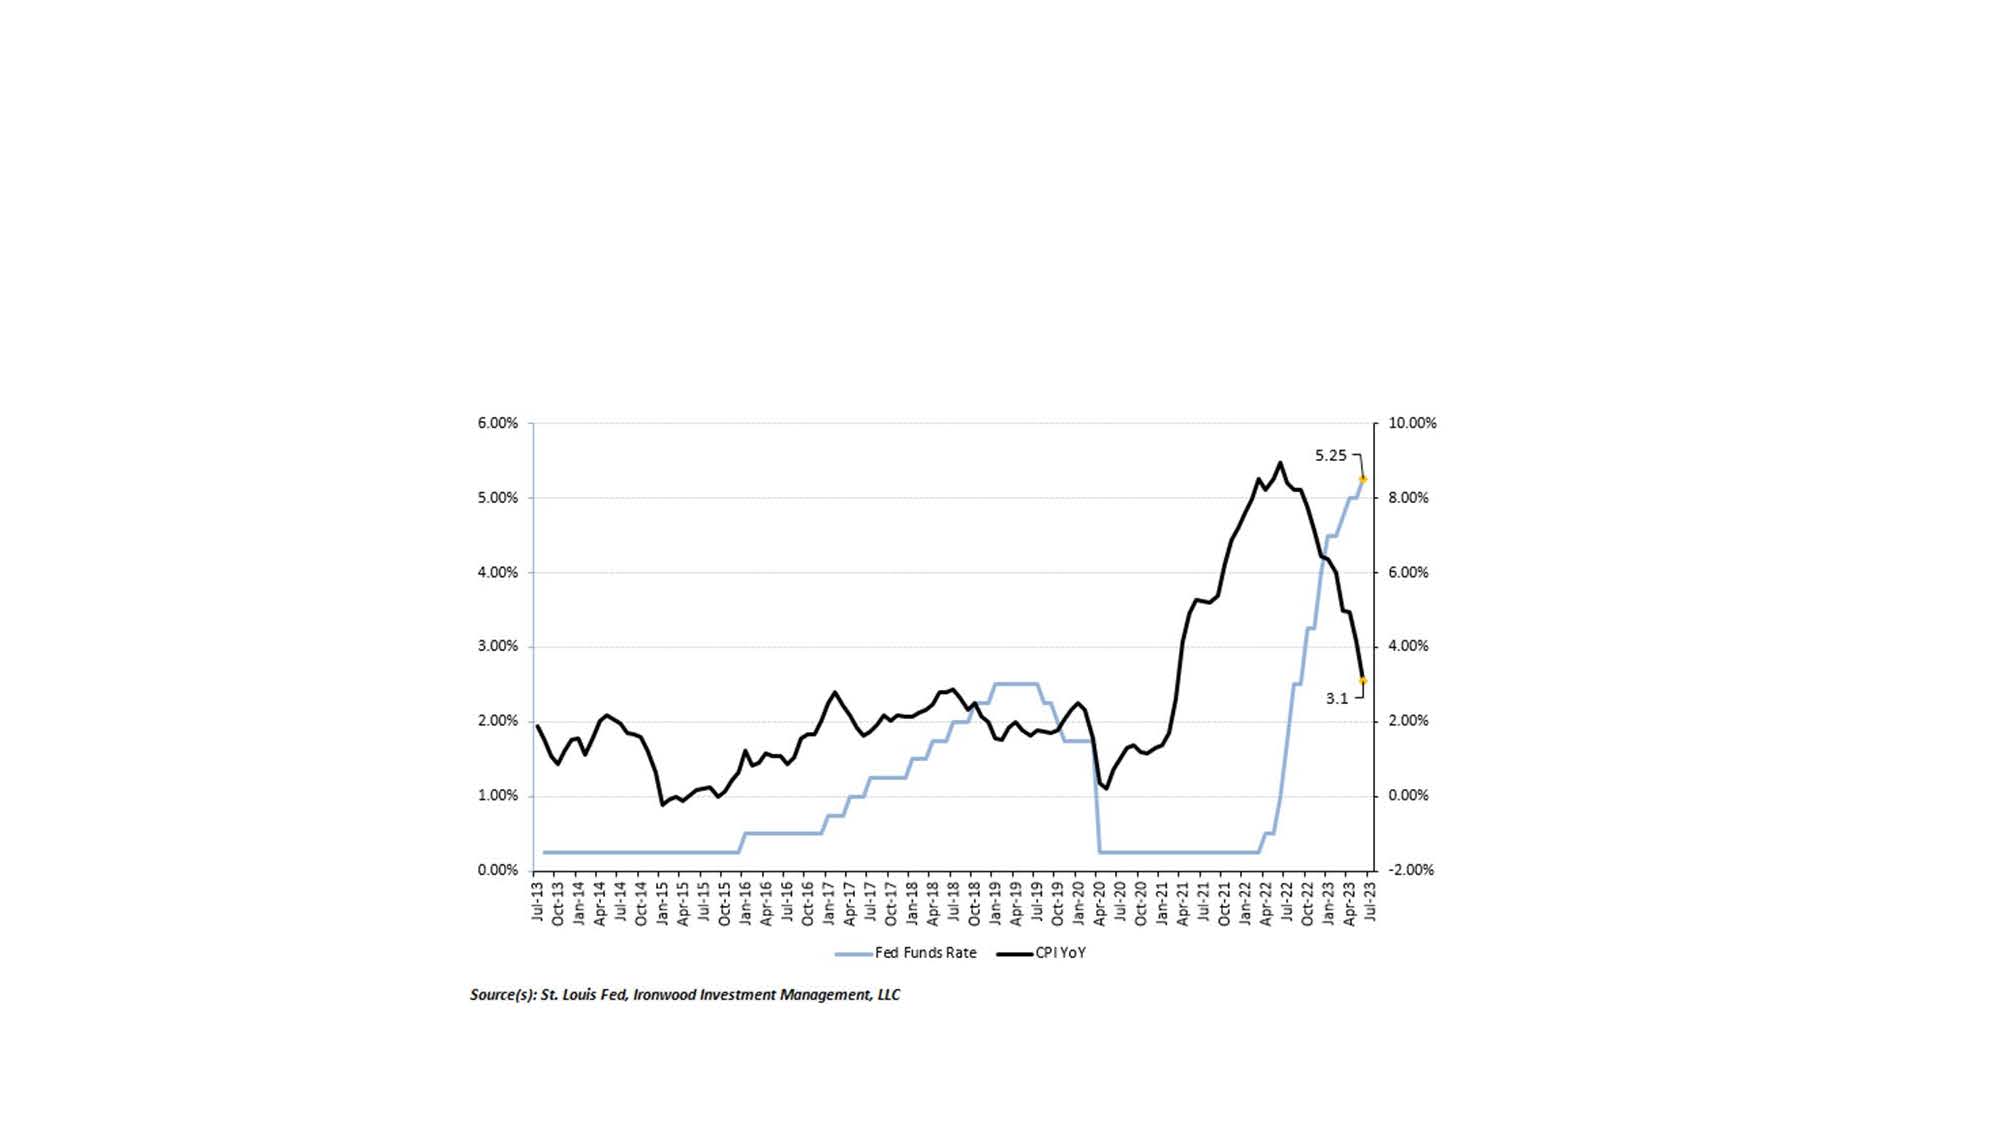
It is hard to be precise in assessing the impact of higher interest rates on inflation, since there is a considerable lag between the two, but it appears that the actions of the Fed are achieving their intended effect. Inflation as measured by the Consumer Price Index (CPI) has declined from a 9% rate in June of last year to a rate of 3% recently, as can be seen in the above chart. The decline in the CPI is abetted by favorable price trends in several commodities such as food and oil, but even excluding these items, inflation rates have fallen significantly. Core CPI, which excludes these volatile items, has fallen to a rate of 3.8%.
Recent economic data paint a picture of an economy that is stable and growing near its long-term rate of about 2.25%. Consumer spending slowed to a modest 1.6% annual rate in the second quarter, as higher rates impacted purchasing power, particularly for lower-income consumers. But job growth remains strong, and unemployment remains low. Interest-sensitive sectors such as housing have been weak but appear to have stabilized. The banking crisis that made headlines in the first quarter with the bankruptcy of three regional banks has so far been contained. In short, it appears that after three very eventful years, the economy is slowly returning to normal.
Given the considerable outperformance of the economy versus expectations, it is not surprising that the stock market has rallied. Corporate profit growth has slowed, but so far in this reporting season most companies are meeting or exceeding very conservative earnings estimates. The consensus is for earnings in aggregate to decline about 2% from last year.
While this year’s market rally is a pleasant turn of events from last year’s market decline, it is notable that the strong performance of the S&P 500 is being driven by a handful of large cap growth stocks. The seven largest companies by market capitalization account for about 28% of the index’s value and have contributed the bulk of the index’s advance. The remaining 493 stocks accounting for 72% of the index are essentially flat. The narrowness of the market advance poses some interesting questions: Will the market rally broaden? Will the rest of the market catch up? Or will there be a correction in the valuation of the large-cap growth stocks?
While the market is now in its green “go” phase, history has shown that at some point the market will enter a new red phase. There are plenty of potential problems that could derail the economy and trigger a market decline. Rather than attempt to predict when a disruption might occur, we believe a better strategy is to invest for the long term. Just think: Whoever invested in the S&P 500 Index at the start of Q3 2018 and held through the market ups and downs, that steady-nerved person would have earned a return of 63.71% through 6/30/23, an average annual return of 10.36%.
The lesson is simple. The equity markets may be volatile and unpredictable, but they can produce good returns for those investors who are willing to take a long-term investment approach.