Oil, AI, and the Volatility of Stock Prices
Investors in US equities have earned good returns in recent years, but they have had to withstand significant volatility to earn them. From the pre-Covid market peak in early 2020 through the September 30, 2026, quarter end, the S&P 500 rose about 127%. Over that stretch of nearly five years, however, investors also endured several sharp declines.

Figure 1. S&P 500 and Russell 2000, January 2016 to September 2026 (indexed to 100).
Source: Yahoo Finance, monthly closing prices (price return). Shaded periods are S&P 500 peak-to-trough declines based on daily closing prices: Feb 19 to Mar 23, 2020; Jan 3 to Oct 12, 2022; Feb 19 to Apr 8, 2025. Past performance is not indicative of future results.
The S&P 500 fell 34% in a matter of weeks at the onset of the Covid-19 pandemic in early 2020. It declined 25% during 2022 as inflation surged and the Federal Reserve raised rates aggressively. And it dropped nearly 19% between February and early April of 2025 when tariffs dramatically increased. This year has been no exception, although the volatility is not apparent in the year-to-date returns of the major indices. At quarter end the S&P 500 was up 12.75% year to date, and the Russell 2000 was up 13.71%. The quarterly returns tell a different story. The Russell 2000, an index of 2000 companies and a good measure of the broader market, gained 21.49% in the second quarter and then fell 7.23% in the third.
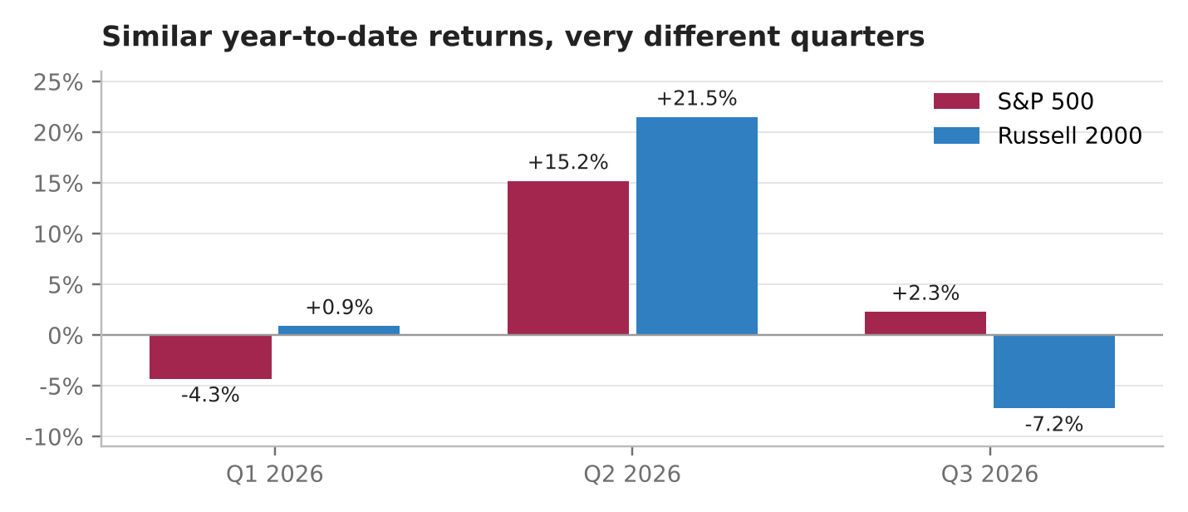
Figure 2. Quarterly total returns, 2026.
Source: Morgan Stanley Investment Management, Equity Market Monitor, Q3 2026 (Q3 and year-to-date returns as of 9/30/2026); Q2 returns from our Summer 2026 letter; Q1 derived from first-half and Q2 returns.
As is usually the case, the gyration in stock prices is being driven by a variety of factors. This year, however, two influences have dominated; the rapid rise in the price of oil and the boom in spending on artificial intelligence (AI).
Oil, inflation, and interest rates
Since the conflict with Iran disrupted shipping through the Strait of Hormuz, a route that normally carries about one fifth of global oil flows, the price of West Texas Intermediate crude has climbed from about $60 a barrel at the start of the year to more than $100 in recent weeks.1 That is an increase of roughly 80%. Oil is used in so many parts of the economy, from gasoline and airfares to freight, chemicals, and plastics, that increases in its price are invariably passed on to the consumer.

Figure 3. West Texas Intermediate crude oil, dollars per barrel.
Source: U.S. Energy Information Administration, Cushing, OK WTI spot price FOB. Monthly averages January 2016 to September 2026; final point is the daily spot price on October 20, 2026.
The effect on inflation has been direct. The Consumer Price Index (CPI) rose 3.7% over the twelve months ending in September, up from 2.4% in January. Energy prices are up more than 20% over the past year, and gasoline is up 34%.2 It is worth noting that core inflation, which excludes food and energy, was a more moderate 2.6%. In our view that suggests the increase is concentrated in energy rather than broadly embedded in the economy, which matters for how long it may persist.
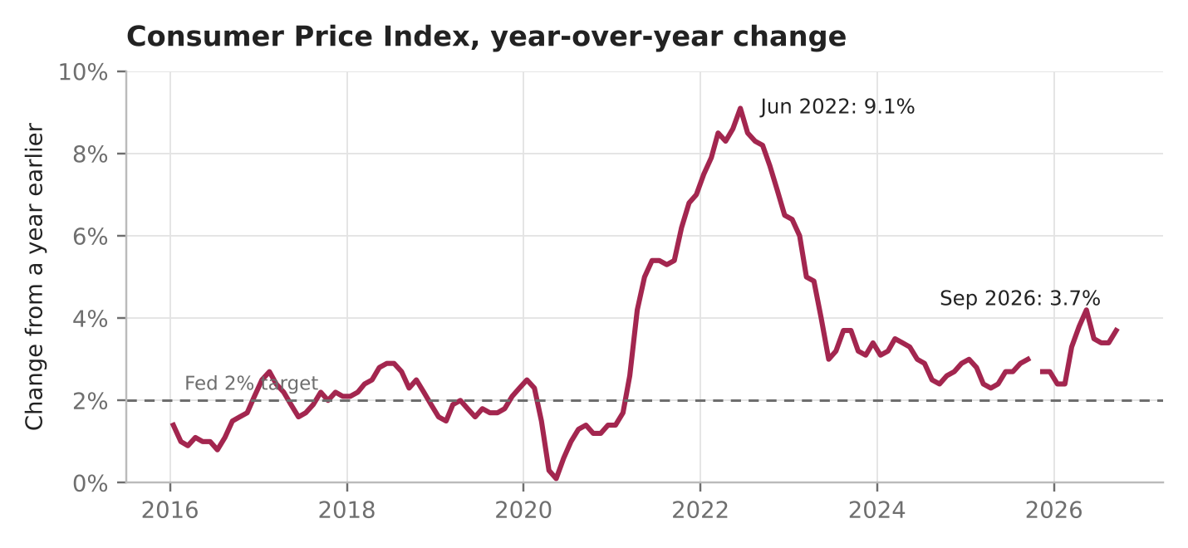
Figure 4. Consumer Price Index, change from a year earlier.
Source: U.S. Bureau of Labor Statistics, CPI-U all items, not seasonally adjusted. No CPI was published for October 2025.
Financial markets have priced in the higher rate of inflation through higher interest rates. The yield on the 10-year Treasury rose from about 4.2% at the start of the year to above 5.3% in early October, its highest level in 24 years. The two-year Treasury yield has risen even more, from about 3.5% to nearly 4.9%. In September the Federal Reserve raised its target rate by 25 basis points, to a range of 3.75% to 4.00%, its first increase since 2023.3
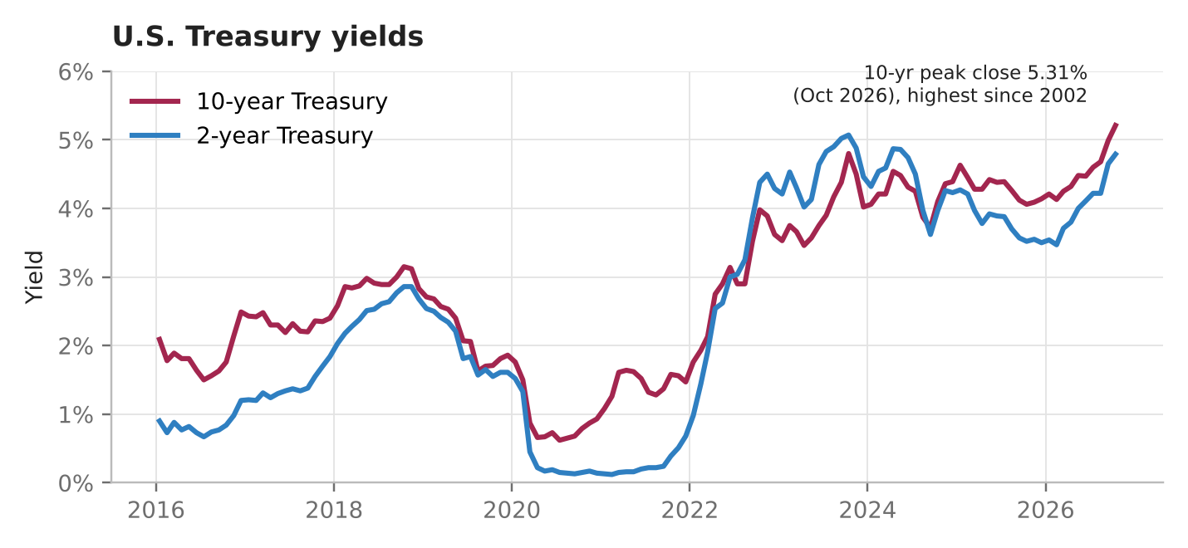
Figure 5. 10-year and 2-year Treasury yields.
Source: U.S. Department of the Treasury, daily par yield curve rates. Monthly averages January 2016 to October 2026 (October through the 20th).
Higher interest rates weigh on stock prices in several ways. They increase the cost of borrowing for corporations. They slow economic growth, which pressures profitability. They make bonds more attractive relative to stocks and compete for investors’ capital. And because the value of a business is the present value of its future cash flows, a higher discount rate produces a lower value today even when the earnings outlook is unchanged. Smaller companies, which tend to rely more heavily on floating-rate debt, can be particularly sensitive to these effects.
The AI buildout
The second major influence on stock prices this year is AI, a topic we discussed at length in last quarter’s letter. The hyperscalers (Amazon, Alphabet, Meta, Microsoft, and Oracle) are spending enormous sums to construct the data centers that AI models require. Their capital spending is estimated at roughly $780 billion in 2026, nearly double the level of 2025, with consensus estimates calling for about $1.1 trillion in 2027 and $1.2 trillion in 2028.
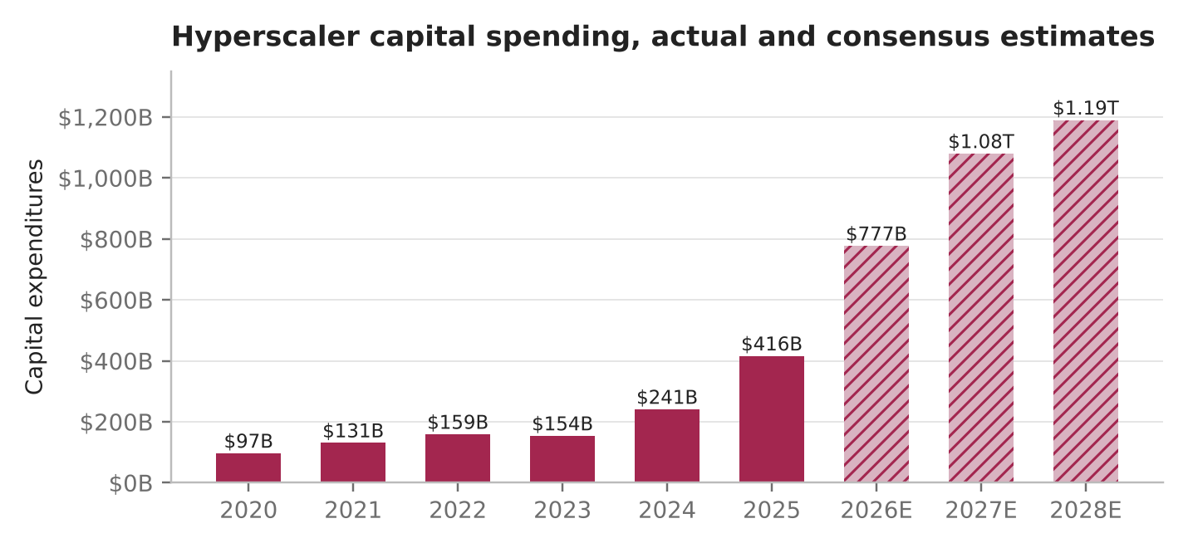
Figure 6. Hyperscaler capital expenditures.
Source: Vanguard, “Hyperscaler capital expenditures (actual and consensus).” Hatched bars are consensus estimates.
That spending is having a dramatic impact on a wide range of industries. The immediate beneficiaries are the semiconductor manufacturers and their supply chain, which produce the servers that store and process the massive amounts of data AI models require. But the benefits spread much more broadly, to the providers of the resources needed to build and run a data center: electricity, water, cooling, and construction equipment. AI is providing a substantial boost to economic activity. ING estimates that AI and related technology investment accounts for roughly a third of US GDP growth this year.4
In the second quarter the market embraced all things AI, and the prices of perceived AI beneficiaries rose sharply. In the third quarter the market had second thoughts about the high valuations afforded those stocks, and a sharp correction followed.
A resilient economy
Against this backdrop of rapid change, the US economy continues to grow. It is impressive how well the economy has absorbed these multiple headwinds. The International Monetary Fund projects US real GDP growth of 2.3% in 2026, roughly double the projected rates for the euro area and the United Kingdom and well ahead of Japan.
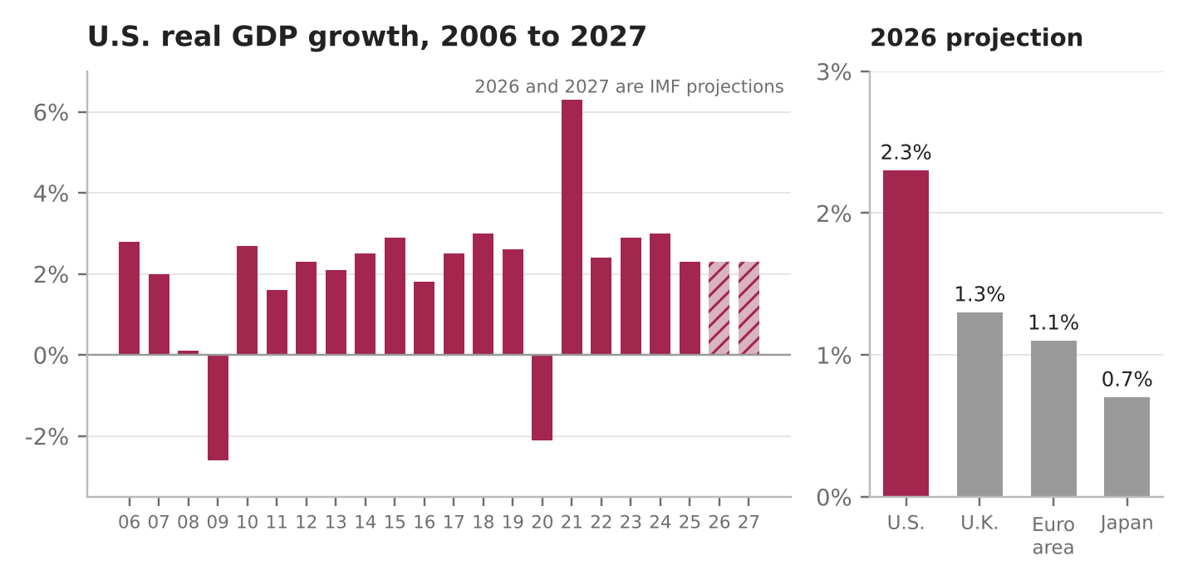
Figure 7. Real GDP growth.
Source: International Monetary Fund, World Economic Outlook, October 2026. 2026 and 2027 are IMF projections.
Growth in GDP is providing a positive backdrop for corporate profitability, and profits are rising to record levels. Earnings for the S&P 500 are expected to increase about 32% in 2026.5 Consensus estimates for the Russell 2000 also call for earnings growth that is considerably higher than that of large companies through the remainder of 2026 and into 2027.6
Because earnings are rising faster than stock prices, valuation multiples have actually declined. The forward price to earnings ratio (P/E) of the S&P 500 was about 19 times at the end of September, down from about 22 times in February and in line with its 10-year average.5,7 Smaller companies continue to trade at a meaningful discount to large companies.6 Given these relatively modest valuations, it is reasonable to ask whether stocks are a bargain.
Risks and opportunities
There are several factors that give investors pause. The longer inflation remains above the Federal Reserve’s 2% target, the more likely the Fed is to respond with further rate increases. If rates rise high enough and persist for long enough, they will slow economic activity, and historically that has been a common trigger for recession. The gains of today’s economy have also flowed disproportionately to the wealthy. Holders of US equities have seen their net worth reach all-time highs, while wage earners in most professions have not seen their pay keep pace with inflation. Affluent households continue to spend while middle- and lower-income households struggle. There are also open questions about whether the extraordinary spending on AI will earn an adequate return on capital, and whether corporations can continue to raise the capital needed to fund a buildout of this scale.
On the positive side, a resolution of the conflict with Iran that restores normal shipping through the Strait of Hormuz would likely bring oil prices down, removing the single largest contributor to elevated inflation. Should inflation fall, interest rates would likely follow. Lower rates would support faster economic growth and, ultimately, higher valuations for stocks.
One additional wildcard this quarter is the national election in November. A change in the balance of power in Washington could shape economic, trade, and energy policy in the years ahead, and could influence the course of events with Iran. We do not try to predict election outcomes, and we would caution against making long-term investment decisions based on such predictions.
The stock market is attempting to sort through all of these issues at once, and the result is heightened volatility, which we expect to continue.
Our perspective
While most investors focus on stock prices and the value of their portfolios, we spend most of our attention on the performance of the individual companies we own. On that measure we are very pleased with the strength and progress of the businesses in the portfolio. There are always a few companies that are struggling, but looking across today’s holdings, the businesses we own are in strong condition.
Volatility is not the enemy of good long-term returns. It creates opportunities to buy high-quality companies, what we call HI-IQ (High Ironwood Quality), at attractive prices. And we are busy researching several new ideas to add to the portfolio.
As always, we appreciate your continued confidence and support.
Sincerely,
