
A Rising Tide Does Not Always Lift All Boats
In the second quarter of 2024, the US economy continued along its path to normalization. Gross Domestic Product (GDP) grew at a healthy 2.8%. Inflation, as measured by the Personal Consumption Expenditures Index (PCE), declined to about 3%, the lowest level in three years. The stock market, as measured by the S&P 500 Index, rose by 4.28% and set a new all-time high. Against this backdrop one would expect that most Americans would be feeling pretty good about the current state of affairs. But if you dig deeper into the data, you can see that not everyone is benefiting from the good times.
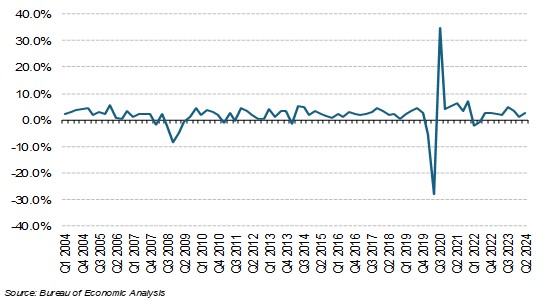
As measured by GDP, the US economy has proven more resilient than many expected and has grown at a healthy pace for the past two years (Exhibit 1).
Exhibit 1. Real GDP Quarter-over-Quarter
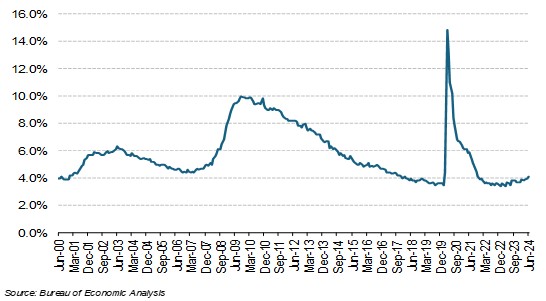
The strong economy has created many new jobs, and the unemployment rate remains low (Exhibit 2).
Exhibit 2. Unemployment Rate
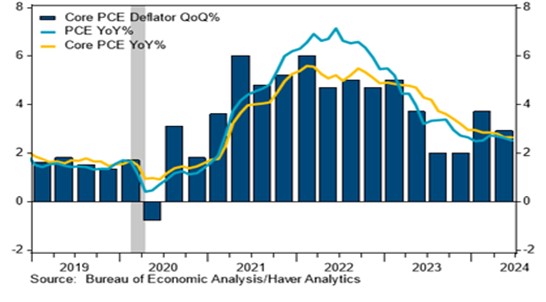
Strong economic growth has put pressure on inflation. Nonetheless, the rate of inflation has steadily declined for two years. Personal Consumption Expenditure Prices (PCE), the Fed’s preferred measure, increased 2.6% in the second quarter of 2024 compared to an increase of 3.4% in the first quarter (Exhibit 3).
Exhibit 3. Core PCE Year-over-Year
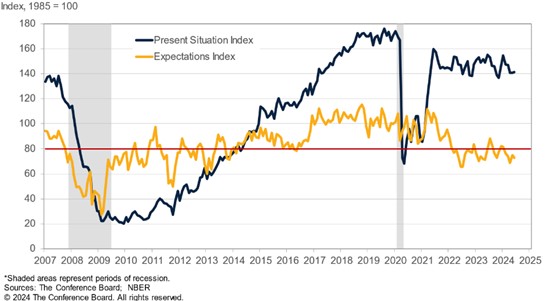
Given the strong economic data, one would expect that most people would be feeling optimistic about the future, but that is not the case. The Consumer Confidence Index, a measure of consumer attitudes that reflects prevailing business conditions and likely developments for the months ahead, shows that consumers are feeling ok with the present state of the economy but are much less confident about the future (Exhibit 4).
Exhibit 4. The Conference Board’s Present Situation & Expectations Index
Further analyzed by age group, the consumer confidence numbers provide important insight into the nature of the economic recovery of the past few years. They suggest that, while most people have in fact benefited from the recovery, the biggest beneficiaries have been older and wealthier individuals. At the same time, many younger and less affluent individuals see themselves as struggling to get by.
The performance data on the US stock market reflects many of the same characteristics as the overall economy. Returns for the S&P 500 have been strong, but not all stocks in the index have been participating in the rally. The S&P 500 is a market-cap weighted index, meaning that the largest companies have an outsized impact on the index. The top ten companies in the index comprise about 30% of the index’s value. The strong performance of these companies contributed almost all of the positive return for the year to date. The mega-cap companies in the index were up 14.7% during the second quarter, while the rest of the index lost 1.2%. In fact, nearly 60% of the 500 stocks in the index were negative in the quarter.
The Info Tech sector had an especially outsized impact on the S&P 500 in the second quarter, as shown in the performance attribution report (Exhibit 5).
Exhibit 5. Q2 S&P 500 Sector Performance Breakdown
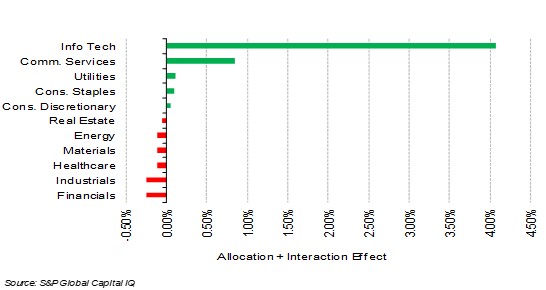
The impact of the mega-cap technology stocks on the performance of the S&P 500 is even greater when considered over the year to date. The size-weighted index has risen 15.29%, while the simple average of its 500 individual constituents returned only 5.08%. Furthermore, nearly 40% of those constituent companies had negative returns this year. The headline news for the stock market has been great, but the bottom line is that the market advance has been driven by a small group of very large market cap stocks.
The popularity of the mega-cap technology stocks has contributed to a rise in valuation for the S&P 500, which now sells for 22x’s forward earnings. By contrast, the valuation of the equal-weighted S&P 500 is closer to the long-term average of 17x’s.
The concentrated nature of recent market returns has several important implications for investors. Recently, the S&P 500 Index has delivered great returns. It is up 86% over the past five years, from a pre-Covid start in July 2019. Its five-year average annual return of 15.07% puts it near the top of the list for all indices in the world. But the tide runs in both directions —in and out. In the market decline of 2022, the S&P 500 fell 18.11% and large cap growth stocks plummeted by 29.14%.
Historically, when a sector of the market gets to be very popular, conditions are ripe for correction. It is almost impossible to predict the timing of such events, but once they start, they usually move quite rapidly. A rising tide may lift boats, but a falling tide lowers them.
Sincerely,
